3D Graphing
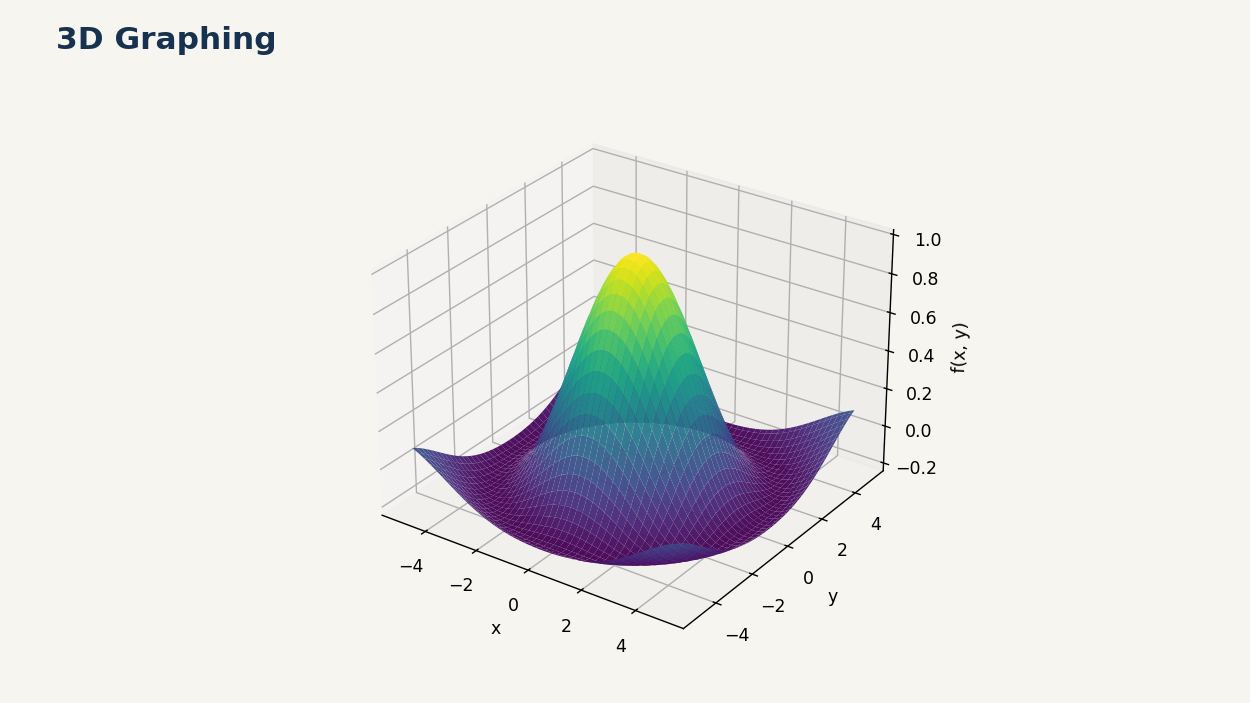
Draw the surface defined by a two-variable function.
Question
How can a two-variable formula be turned into a readable picture of a surface?
Goals
- Sample a function of two variables and represent its values as points in three-dimensional space.
- Render a surface that can be rotated, scaled, and viewed from different directions.
Method
Treat the formula as a height above each point of a grid.
- Evaluate the function on a rectangular mesh of input points.
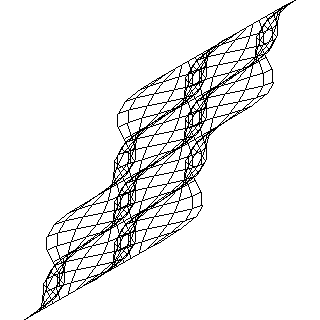
- Join neighbouring points to form a wireframe or shaded surface.
- Apply projection and coordinate transformations to produce the final image.